Data Reporting and Dashboards
Get the insights you need to advance your clinical trials.
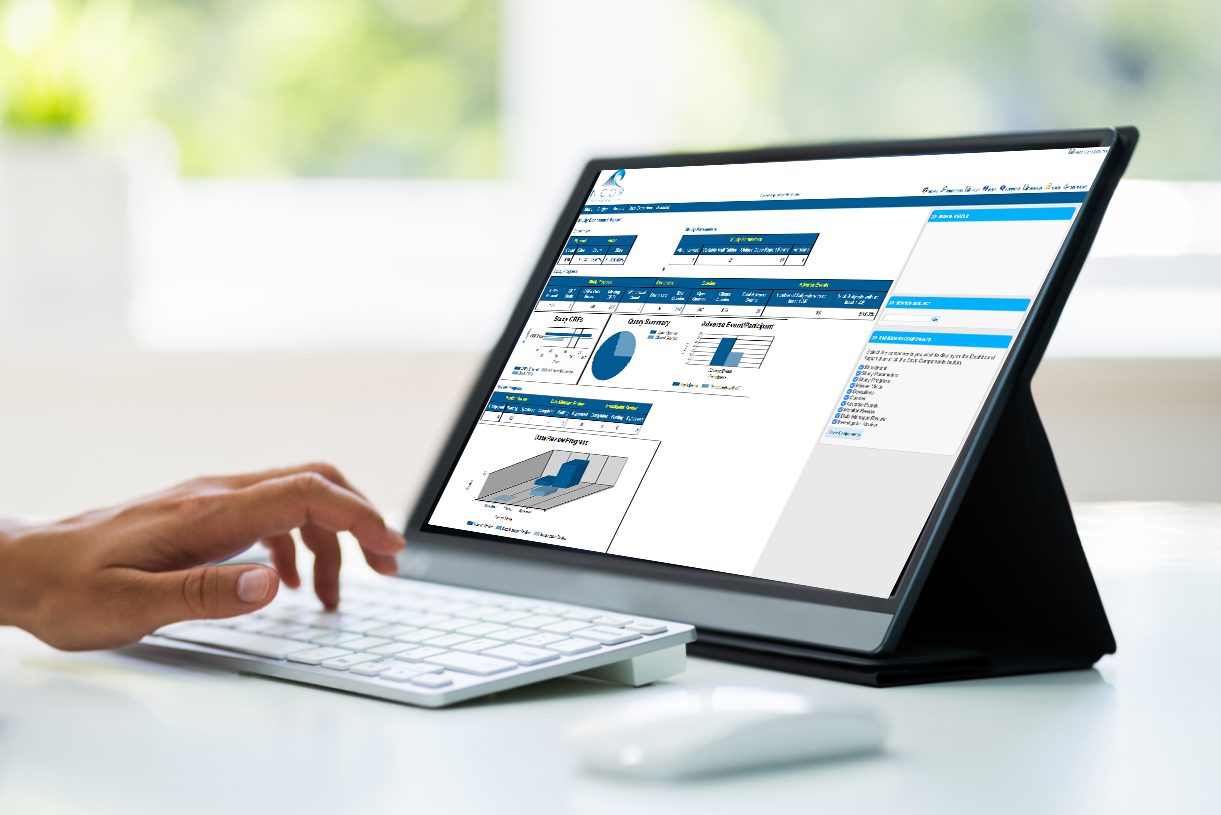

Review your clinical trial metrics in the moment with real-time reporting.
Keep your study on track with robust reports and analytics. Make data-driven business decisions by integrating with your preferred business intelligence tool.
One of the standout features of TrialKit is its easy reporting capabilities. I could seamlessly export entire datasets providing clinical and data teams with valuable insights into the study progress and easy visibility into data issues. The detailed reports provided by TrialKit became an indispensable tool for the entire clinical team.
Head of Clinical Operations

Why TrialKit for Data Reporting and Dashboards?
Generate actionable clinical and business insights from one powerful tool. With TrialKit at the wheel, you can generate interactive downloadable reports fueled by powerful analytics.
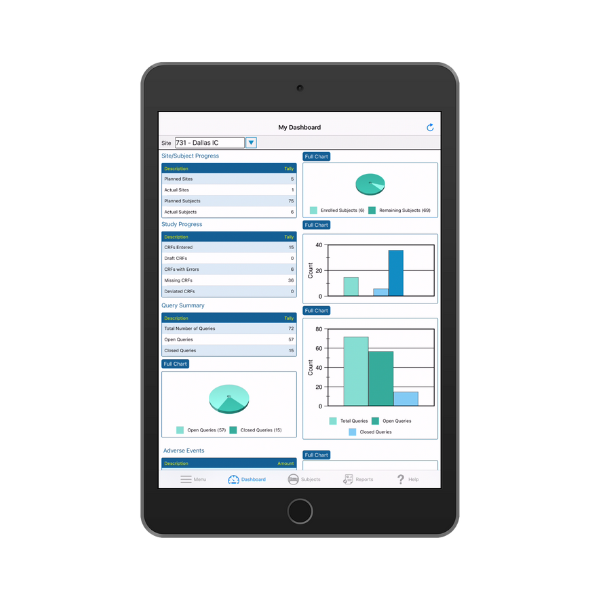
Real-time reporting
Get your questions answered in the moment with real-time reports that update automatically. Schedule those reports to run daily or weekly to a secure FTP or another location of choice.
Cost-effective metrics
Do you need convenient access to data and performance metrics? Are you on a tight budget? TrialKit is an affordable, highly effective solution.
Answer burning questions
Whether you need a straightforward study summary or you want to track site progress, TrialKit delivers the data. Reports include charts, graphs, and numbers for max usability.
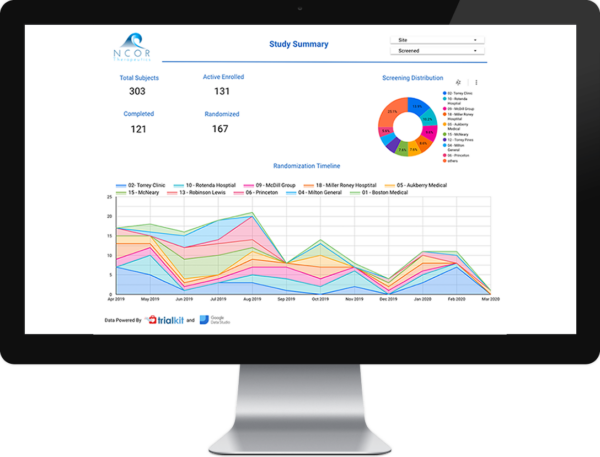
Integrate with BI tools
Inform clinical development programs with detailed business intelligence (BI) insights. By working with one of our certified partners, you can access BI reports generated from common reporting engines like Looker Studio—all rich with data provided from TrialKit. The result: robust reporting of key operational metrics.
Example Reports
- Form Data
- Query Aging
- Data Change Audit
- Subject Visits
- Site Payments
- Medical Coding
- Inventory
- Queries
- Site Progress
- Subject Status